Insight Blog
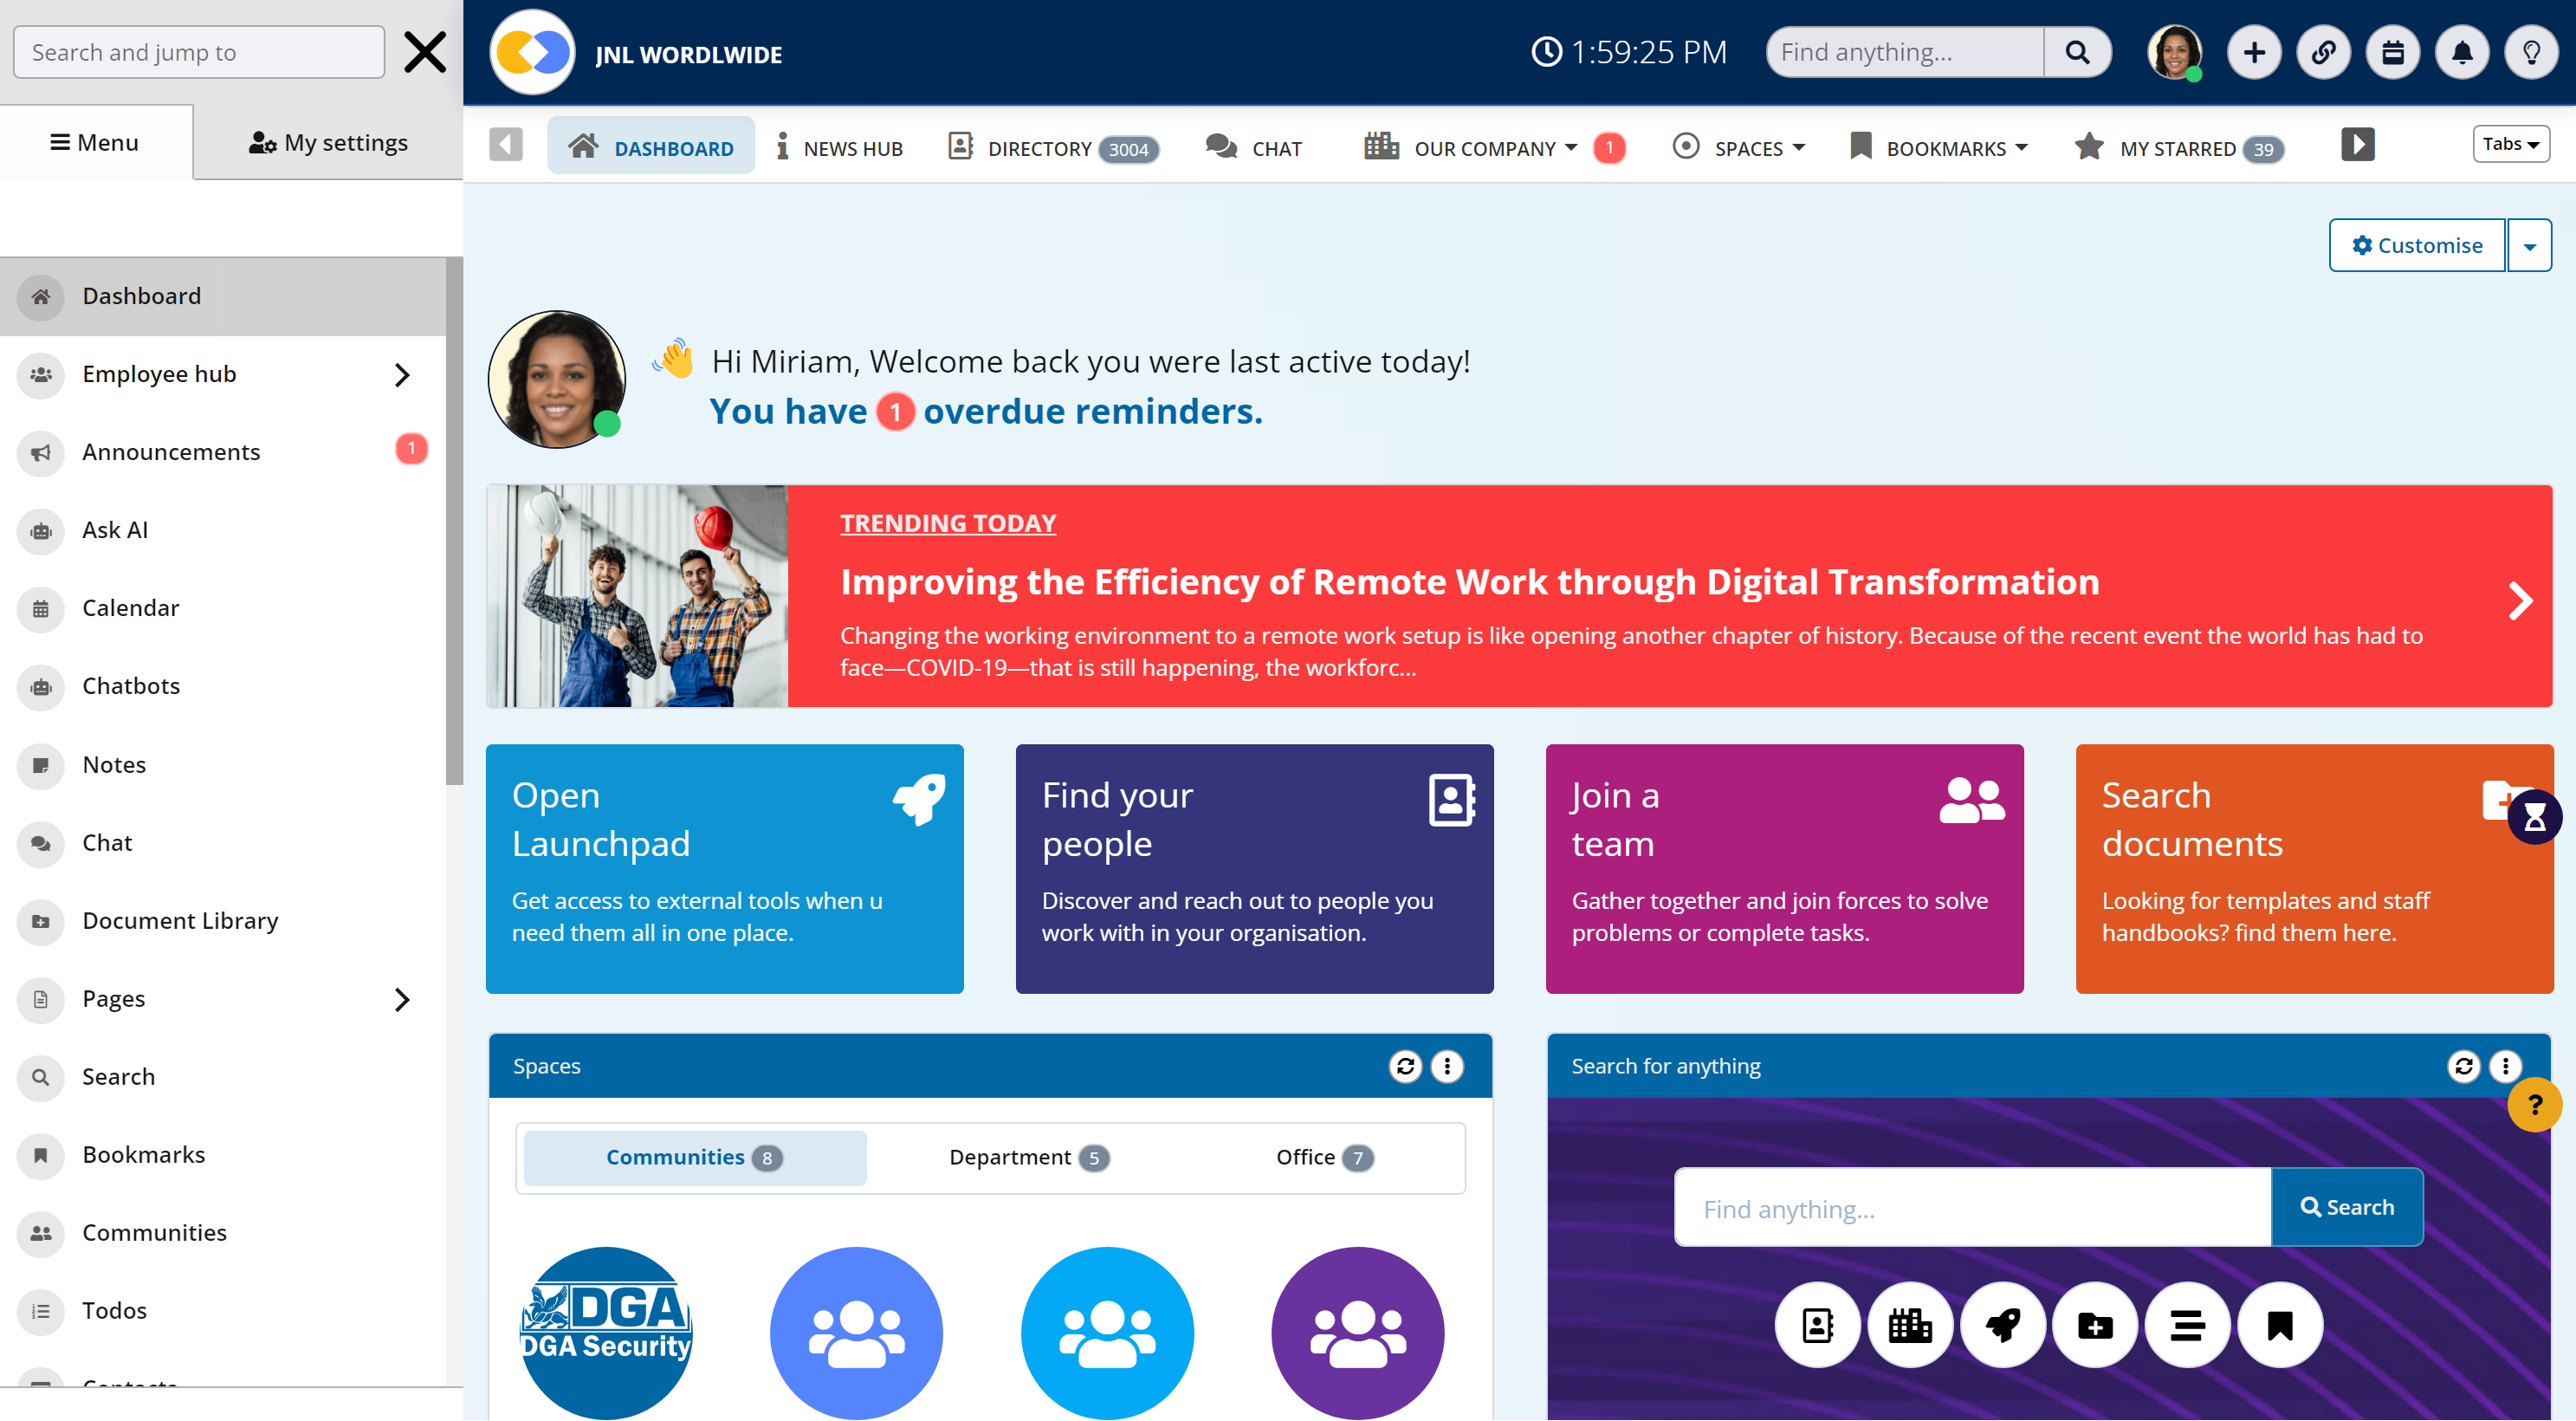
Agility’s perspectives on transforming the employee's experience throughout remote transformation using connected enterprise tools.
8 minutes reading time
(1659 words)
4 Ways to Tell if You Need a Corporate Governance Dashboard

4 Ways to Tell if You Need a Corporate Governance Dashboard
Find out more about the benefits and potential uses of data dashboards and how can you build the best data dashboards for your organization.
4 Ways to Tell if You Need a Corporate Governance Dashboard

No matter their size or industry, businesses of all stripes deal with massive amounts of data daily. Access to this data aids their improvement and allows them to gauge their progress. However, information alone is insufficient. To get the most out of it, compile relevant information in one place, verify its quality, and distribute it in a usable format.
Information may be easily shared and used to inform decisions using data dashboards. Why are these monitoring interfaces helpful? What are their options?
How can I create a fantastic one for my organization?
Here, we'll break it down for you.
When Should You Use Corporate Governance Dashboard?

4 Ways to Tell if You Need a Corporate Governance Dashboard
Simply said, a data dashboard is a page that graphically presents relevant data. This arrangement works well for organizations. Specifically, users need corporate governance dashboards when they need to:
1. See the Latest Data Anytime
It is crucial for a data dashboard to be able to update with new data as it becomes available. It automatically refreshes and connects to your data streams. Having this latest information at their fingertips allows your staff to act decisively and efficiently.
No longer are weekly reports or manual upgrades required. With a dashboard, you can be certain that the data you need to make decisions accurately represents the present, providing a flexible and adaptable solution for today's rapidly evolving business climate.
2. Bring All Your Data to One Place
Information dashboards function as a hub, collecting and organizing data from several sources into a unified display. They provide a bird's-eye perspective by combining data, allowing for the examination of various metrics and statistics in the context of one another.
This synthesis is vital because it transforms raw data into useful insights, allowing team members to make data-driven choices with less effort and time spent combing through disparate systems and reports.
3. Understand Data Through Pictures
Dashboards provide a graphical representation for analyzing data via the use of charts, maps, and timelines, which may be interpreted in several ways. These visualizations facilitate comprehension of essential performance metrics (KPIs) and identify trends that may need attention.
Visual representation of data, such as on a dashboard, enables faster analysis and identification of trends compared to relying just on textual or numerical data.
Consequently, this results in a more efficient method of analysis, enabling consumers to instantly understand complicated data items.
4. Make the Dashboard Yours
The ability of data dashboards to be customized according to the user's preferences is a significant benefit. Every department has distinct requirements, and a dashboard may be tailored to accurately represent those variations.
Teams have the ability to select the key performance indicators (KPIs) that are most important to them on their dashboard, whether it be sales objectives, marketing data, or operational efficiency.
The key performance indicators (KPIs) shown, the data visualization techniques used, and the types of data sources used may all be tailored to the needs of the individual user.
This degree of adaptation makes the dashboard more than a simple instrument; it becomes a strategic asset serving the needs of the organization as a whole.
Who Uses Data Dashboards?
Who Uses Data Dashboards
Many individuals, both within and outside of an organization, may benefit from data dashboards.
Employees
Dashboards are a fantastic resource for workers. They may use these dashboards to see information organized by subject area. Everyone can observe how effectively the organization is doing toward its overall objectives.
Executives and managers like dashboards for instantly assessing progress and identifying areas for improvement.
Workers are sometimes able to make adjustments to the dashboards themselves, such as adding information about a new safety risk. Employee morale may be boosted when they are given a clear picture of the company's direction and success.
Follow us and access great exclusive content everyday: Follow us on Google News
Partners
Dashboards may be made available to both internal and external stakeholders. A business may share information about its networks with its maintenance partners or stock levels with its suppliers to facilitate better coordination.
There are a variety of methods to do this, from providing restricted access to the company's data to developing individualized dashboards for each of the company's partners. This adds value and may be profitable, but it's crucial to monitor access for security reasons.
Everyone else
Anyone may use a dashboard, not only employees or partners. If the information is not confidential, a business may release it to the general public. This may be an attempt to demonstrate that they are an ethical business by highlighting the work they are doing to improve the environment.
Or, it may be for sharing essential knowledge with everyone, like how much energy a neighborhood consumes, what's happening with local budgeting, or when the next major event is.
Characteristics of an Excellent Dashboard
The best dashboards are interactive displays of data that help consumers grasp the big picture and make informed choices. Some guidelines for making a top-notch corporate dashboard are as follows.
You may also like: Best Apps for Employees: UPDATED 2022 – A Complete Guide
Data Preparation
The reliability of the data in a dashboard is crucial to its success. Before any graphical representation is constructed, it is necessary to ensure that the data is free of mistakes and inconsistencies.
It is common practice to clean data, verify its correctness, and identify a trustworthy source as part of this procedure. A reliable dashboard is the result of extensive planning. Well-curated data helps to prevent mistaken findings, emphasizing the dashboard's position as a light of knowledge.
Data sorting
It's not just about showing plenty of data on a dashboard; it's also about showing the proper data.
The challenge of creating an effective dashboard is finding the right facts to highlight that will be most useful to the intended audience. In this way, every piece of information is carefully culled to fulfill the organization's larger goals and the users' individual tasks.
Free ebook: How To Get Your Intranet Off The Ground
Data Visualizations
Data visualization is the key to making numbers talk. Key indicators, graphs, and maps may summarize complicated patterns in a dashboard's graphical representation.
Users may understand the tales hidden in data via the construction of visual narratives that include several parts. Such data visualizations not only make sense of the raw data but also captivate the user by giving them a tale to follow.
Teams that need governed, pixel-perfect charts alongside ad hoc views can embed a reporting layer directly into their dashboard stack.
Using C# .NET reporting solutions, you can design reusable report templates, bind to multiple data sources, enable drill-down and parameters, and export to PDF, Excel, and HTML—whether you deploy on ASP.NET Core, Blazor, or desktop (WinForms). This approach centralizes KPI definitions while letting stakeholders consume interactive reports within the same portal.
Ease of Use
There has to be a happy medium between complexity and usability in a dashboard. It has to be user-friendly for people of varying data literacy levels so that everyone may benefit.
The dashboard's usefulness increases thanks to the incorporation of features like simple searching, quick sorting, and adaptable data exporting. Because of its accessibility, users are more inclined to dive into data analysis and creatively apply their results.
The Three Main Kinds of Dashboards Used in Companies

The Three Main Kinds of Dashboards Used in Companies
Companies use three kinds of dashboards, and here's what each one does:
Dashboards for Keeping Track
These dashboards are like a digital report card for an organization, and they are designed with upper-level management in mind.
They provide crucial metric indications to check whether the organization is on track with its goals and pinpoint problem areas. One example is a financial dashboard, which displays income and expenditures to facilitate better budget management.
Executive decisions are recorded on dashboards to increase openness throughout the company. Strategic dashboards distribute vital, often cutting-edge, data that has the potential to affect norms and practices in a certain sector.
Dashboards for Everyday Work
A management dashboard is a crucial interactive tool for daily operations. Railway businesses may employ them to manage train timetables and maintenance, boosting efficiency throughout the network.
They aid in asset management for housing businesses by providing an overall picture of building and renovation projects. In order to ensure the timely and successful completion of environmental projects, dashboards may coordinate the work of numerous parties.
Dashboards for Communication
Organizations may better serve their constituents with the help of communication dashboards. They help businesses gain the public's confidence by demonstrating their commitment to social and environmental responsibility.
For instance, they may publicize available positions to a wider audience in the hopes of luring better applicants.
In the energy industry, for example, where information sharing helps joint efforts towards environmental sustainability and decarbonization objectives, they also enable community involvement by making useful data more widely available.
Wrapping up
When it comes to providing actionable insights from complicated data for different stakeholders in a company, dashboards are useful tools. They may be used for a wide range of purposes, including keeping tabs on key indicators for internal review, supervising day-to-day operations, and promoting public openness.
They not only simplify operations but also help strategic decision-making, boost communication, and foster cooperation.
Dashboards, as digital hubs, play a crucial role in helping businesses achieve their objectives, streamline their operations, and foster a culture of transparency and creativity that is felt not just by employees but also by the people they serve.
Most Popular Posts

Effective communication among team members is vital for the productivity and success of any organization. Surprisingly, 60% of companies lack a long-term internal communication strategy, which p...


Businesses thrive on communication for efficiency, productivity and accomplishment. When the right information is passed from the right designation in the organization, it promotes positivity an...
Categories
Blog
(3012)
Business Management
(380)
Employee Engagement
(225)
Digital Transformation
(194)
Growth
(143)
Intranets
(137)
Remote Work
(63)
Sales
(53)
Collaboration
(48)
Customer Experience
(30)
Culture
(30)
Project management
(29)
Knowledge Management
(28)
Leadership
(20)
Comparisons
(9)
News
(1)

Related Posts

Generative AI has rapidly moved from trend to transformative force, reshaping industries across the board. But perhaps its most visible impact has been in the marketing world—streamlining everything from ad creation to email copywriting in seco...

Many businesses still rely on software that was built 10, 15, or even 20 years ago. At first glance, these systems may seem cost-effective because they are already paid for and deeply embedded into daily operations. However, beneath the s...
")
Artificial intelligence is everywhere right now. From employee communication platforms and HR software to project management tools and company knowledge bases, businesses are racing to add AI to their workplace technology stack. The promise is ...

Launching a startup is exciting, but it can also be expensive if you build the wrong product. That's why many founders choose to start with a Minimum Viable Product (MVP) before committing significant time and money to full-scale development. A...

Walk into almost any workplace today and you'll find employees juggling a growing number of tools. One platform for chat, another for project management, a separate HR system, multiple document repositories, and countless email chains just to g...


Jill Romford
I am a digital nomad, lover of exploring new places and making friends.
I love to travel and I love the internet. I take pictures of my travels and share them on the internet using Instagram.
Traveler, entrepreneur, and community builder. I share my insights on digital marketing and social media while inspiring you to live your fullest life.
Ready to learn more? 👍
One platform to optimize, manage and track all of your teams. Your new digital workplace is a click away. 🚀
Free for 14 days, no credit card required.